Lead Engagement vs Sales Outreach: Simple Reports to Improve Sales Performance


The world of CRM and marketing automation can be pretty daunting and complex, as well as the tools that make up this space. However, this doesn’t mean that deriving useful insights has to be a complicated process too. All too often new and inexperienced users find themselves overwhelmed trying to create unnecessarily convoluted reports to solve for business needs when some of the most impactful insights require minimal effort.
***Disclaimer***
Before we dive any deeper, please be aware that the remainder of this post will only focus on the Hubspot CRM and Hubspot Marketing tools.
You can build a similar report and gain the same insights if you have Salesforce and Pardot, but both tools are required and the field names within the report will obviously be different.
Back to it!
A perfect example of a simple report in Hubspot that can drive a lot of alignment and process improvement between sales and marketing is one that compares a user’s Last Contacted Date and following three marketing activity dates:
- Last Email Click Date
- Time of Last Visit
- Recent Conversion Date
The difference between the Last Activity Date and any one of these three marketing activity dates yield a plethora of potential insights about the efficiency of your sales team and their performance as it pertains to contacting leads. Here is a list of a few of the insights you can derive:
- How timely is your overall sales team is at following up with recently engaged leads
- Which individual sales representatives struggle or excel in following up with engaged leads
- What's the current bandwidth your sales team when it comes to contacting new or engaged leads
- What assets are re-engaging old or gone dark leads with your marketing assets
- Do your reps utilize the Hubspot CRM platform for logging activity and how diligent are they at doing it
After we walk through how to build the report in Hubspot we’ll revisit these insights and tie them to the report.
Just to be clear, in Hubspot terms we’re actually building a list. Reports, as Hubspot defines them, are built off of lists.
Hubspot Sales List Contact Properties and their Definitions
Alright, so what are these fields that make up this report and what do they tell us individually?
What is the Last Contacted date? Plain and simple, this is the most recent date that a prospect was contacted by a sales rep and had that activity logged on their record. These activities can take one of three forms:
- A call
- An email
- A meeting
The other three fields are pretty self-explanatory:
- Last Email Click Date is the most recent date that an email was clicked on. Not the last time an email was opened! That is a different property and the distinction between the two is very important.
- Time of Last Visit is the most recent date a prospect visited your site.
- Recent Conversion Date is the most recent date a prospect submitted a form.
How to Build the Last Contacted Date vs Last Marketing Activity List
Now that we understand what we’re building and why, let’s get down to the nitty-gritty and build this thing.
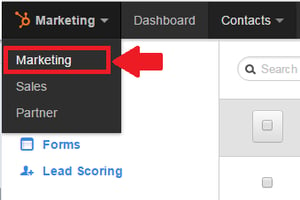
First off, ensure that you are viewing the marketing interface in Hubspot, not the sales interface. Trying to create this list via a custom view within the contacts tab, in the Sales interface, won’t work. The available logic can’t be set up appropriately. If you aren’t in the correct view, select it from the drop-down in the top left corner of the UI.
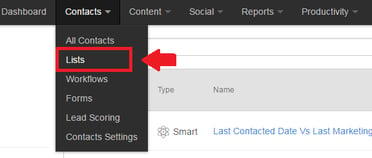
Once you’re on the marketing interface, navigate to the Contacts tab, open the drop-down and select Lists.
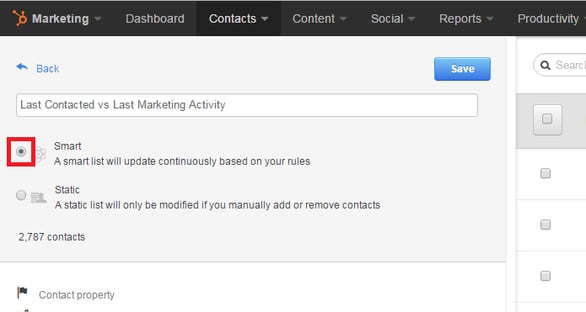
Click New List, in the top right corner to begin constructing the list. Name the list something reflective of this data you’ll be analyzing. I went with Last Contacted vs Last Marketing Activity. Next, ensure that you’ve selected a Smart list instead of a Static list. You’ll want this report to continuously update as your sales reps interact with leads.
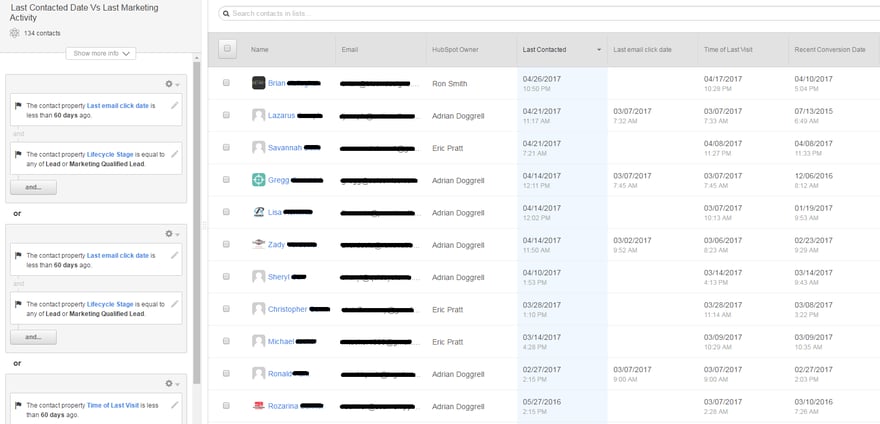
Let’s select the columns that will matter most when we’re analyzing this list. I personally like to view things in an order of operations sense, but feel free to customize this to your own preferences and needs. The fields I chose to include are as follows:
- First Name
- Last Name
- Phone Number
- Hubspot Owner
- Last Contacted
- Last Email Click Date
- Time of Last Visit
- Recent Conversion Date
- Lifecycle Stage
- Lead Status
Moving right along, setting up the list’s logic is the next step. This will vary slightly for everyone depending on how your organization leverages different sale’s lifecycle stages and lead statuses. However, before we get into that, let’s set up the logic for our three marketing activity dates:
- Last Email Click Date
- Time of Last Visit
- Recent Conversion Date
The logic for these three contact properties is the same. Under the filter options, select contact property. Then, select one of the three necessary contact properties. For the time parameter, select “is less than” and the number of days you deem relevant. I usually default to 60 days of activity. Next, include an “and” logic statement after the time parameter and specify the appropriate sale’s lifecycle stage or lead status. As I mentioned above, this is where your reports will likely differ depending on how your organization leverages lifecycle stages and lead statuses.
This additional lifecycle and lead status logic is very important. If you only pull in the three marketing activity properties and their associated logic, you’ll pull in every contact in your database. To derive the insights we want, you’ll want to refine the list of contacts by their sale’s lifecycle stage and led statuses. Usually targeting leads with a lifecycle stage of Lead or MQL and a lead status of “open” or “new” deliver the best list make your assessment. It really comes down to how your organization leverages these properties (if at all) and how reliable the data is for them.
Repeat this exact process for each marketing activity contact property. The logic should look something like this:
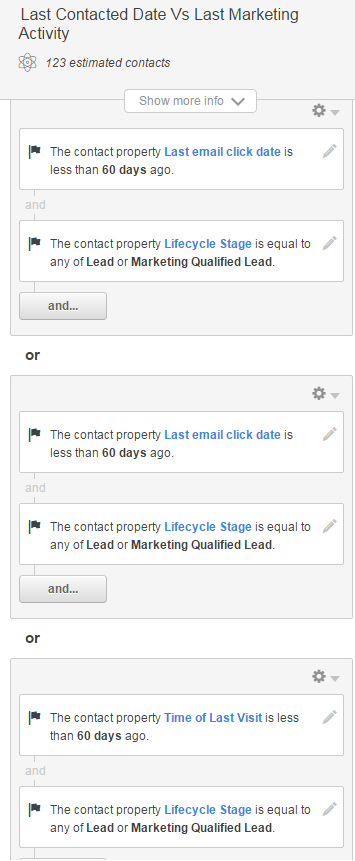
When you’ve finished the above, save the list and you’ll be done with the construction phase. The final list should turn out like so:
Analyzing the Sales Data from the Last Contacted Date vs Last Marketing Activity List
Let’s revisit the list of insights I mentioned at the beginning of the post that you can derive from this list:
- How timely is your overall sales team is at following up with recently engaged leads
- Which individual sales representatives struggle or excel in following up with engaged leads
- What's the current bandwidth your sales team when it comes to contacting new or engaged leads
- What assets are re-engaging old or gone dark leads with your marketing assets
- Do your reps utilize the Hubspot CRM platform for logging activity and how diligent are they at doing it
How you extrapolate these learnings only starts with the list. You have to combine a mix of art of and science to get to the end result.
Identifying the Sales Report Data and Trends
We’ll start with the science first by breaking down the dates in this list. This analysis is quite simple and is best done by exporting the list data into excel.
After exporting the data, compare the Last Contacted date to the most recent of the three marketing activities dates and find the difference. That’s it.
Studies show that the sooner a sales representative reaches out to an active or engaged lead the better the chances are that they will get that person on the phone. Most companies strive for a 24 hour maximum lag time between when a lead was last engaged to when they are contacted by a representative. This lag time is usually part of marketing and sales SAL.
As you progress down this exported list, calculating the differences between dates, pay attention to the Hubspot Owner and see if you can identify trends by owner. Who are the reps with long lag times? Which reps have the shortest lag times? What is the average lag time for the entire sales organization?
Connecting the Data to your Sales Team
This is the point where the art comes into play.
Once you’ve got an understanding of who your best and worst performers are, as well as how your overall organization is performing, it’s time to start talking to the men and women in the trenches. Take your data to them and start poking around to see what you can uncover about their work habits, selling methods, or gather general qualitative feedback. From there connect the dots.
Here are a few examples of what you might uncover.
If you find that the organization as a whole has a very long lag time between engagement and contact, it could speak to several different issues:
- The organization isn’t logging their interactions when reaching out to prospects and thus a problem with platform adoption or data cleanliness exists, give this post a read for tips on how to improve CRM adoption
- Sales reps could be overloaded and not have enough bandwidth to get to everyone in time, thus eluding to your sales team being understaffed or your reps having bad selling habits
- Your current sales process might be inefficient, consider revisiting your customer’s buying cycle and how it relates to the product you’re selling to see if there is room for optimization
If your organization as a whole has a relatively short lag time between engagement and contact, but you have a few outliers who are dragging the overall average time down, you’ll now know who to focus on for performance improvements.
One suggestion to improve this performance is to show a list of on the individuals within your sales organization in order of best to worst lag times. Do this on a regular basis, perhaps in a weekly sales meeting. Doing this adds accountability to your individual reps because their times are publicly displayed, but it can also insight healthy competition between your reps.
If you want to take all of this a step further, one advanced tactic to try is to compare the close rates of individual reps and to their contact times. Assess the trends you find and determine if there is a correlation between low tag times and high close rates.
Combine the science and art of this process to draw new and powerful conclusions that will improve your sales team’s performance. Don’t stop with just this report. There are plenty of other simple reports you can create to really move the needle.
In addition to reports like these, Hubspot has a great guide on how to measure the productivity of sales teams.

