

When you've implemented a pillar page strategy, it can be easy to check it off the marketing to-do list and wait to revisit until the next planning year rolls around. But this goes against one of the fundamental ideas behind the pillar page strategy: to try to solve your readers' problems as comprehensively and relevantly as possible.
Pillar pages are not one-and-done deliverables in your marketing plan. They're a long-term strategy that requires consistent optimization and research--even long after it's started to rank in SERPs.
As you build a plan for long-term optimization, it helps to focus on a few key metrics:
- Organic traffic growth
- Time spent on page/scroll length
- New or influenced contacts and revenue
In this post, we'll walk through one main pillar content example to show how we have (and will continue to!) optimized a pillar page using the KPIs above and some optimization strategies below.
Today's example is for a national safety equipment and education company, where we've developed an entire marketing campaign strategy specifically for one of their core areas of business: safety boots and shoes.

Reoptimize Your Linking Strategy + Technical SEO
When it comes to reoptimizing your pillar page, your mind might instantly go to technical SEO optimization. This is a great place to examine how your page is performing so far, since the entire goal of a pillar strategy is to build organic traffic and domain authority on your core topics.
Our Search Strategist, Juliette Tholey, already has a great piece on technical content optimization that is packed with pro tips on backlinks, readable page design, and content formats. I won't give you the play-by-play here, but make sure you read it to tackle this step--and make a recurring calendar invite on your calendar to consistently check back on your pillar page performance over time.
Long-term optimization is about continually visiting these core marketing pieces to make sure that if something could be better, you take the next steps to execute.
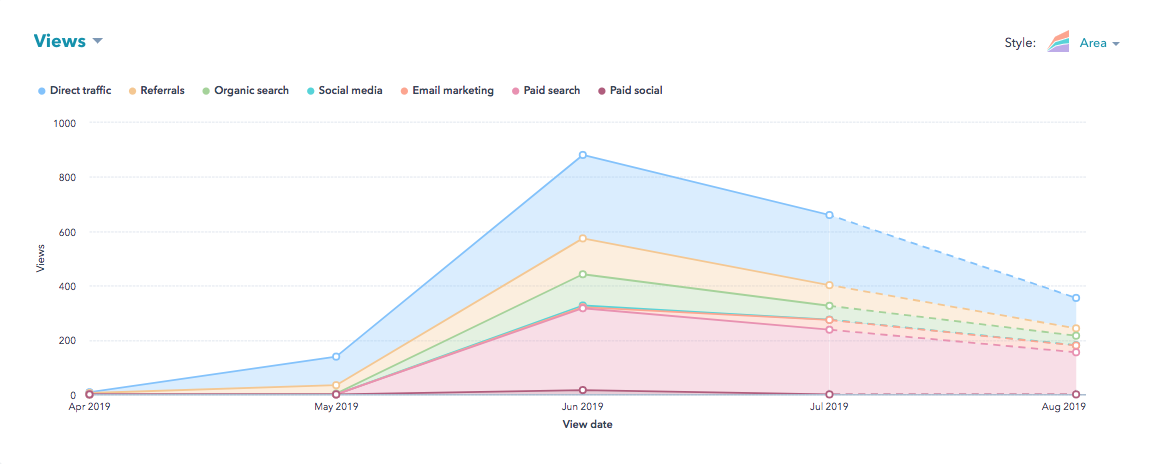
We can see based on our pillar page example for this post that our organic traffic is certainly growing, but it is not yet our #1 traffic driver. We'll likely revisit the SEO and linking strategy behind it in our iterations this year to answer a few questions:
- Is this target keyword still the best opportunity?
- Are there any new competitor pieces that could be drawing traffic from our pillar page?
- Could we find new keyword opportunities that are an even better fit for our main keyword?
- Are there new videos, photos, etc. that we could add strategic Schema to in order to increase Google's trust in our voice on this topic?
- How can we incorporate new industry terms, trends, etc. into this pillar content to make a more useful, helpful piece than any of our competitors?
Use Heatmap Software to Understand UX/UI Performance
You can see time spent on-page in HubSpot, but tools like LuckyOrange and HotJar are also helpful in finding out how much of your pillar page your viewers are actually consuming. You can view metrics like "scrolls," which shows the percentage of real viewers who get to real points of your page.
- If you're seeing a low percentage of people make it to the bottom of your page or to your CTAs with the next steps in the buyer's journey, you'll know you need to shorten the content or change the layout to be a shorter web page overall.
- You can also view "clicks," which will show you where most viewers are actually trying to click on your site. Are they clicking on banners or images that you haven't actually linked out to anything? Great--add links to them to next-step content! Are some of your external links getting far more clicks than others? Now you know what really interests them, and you can remove irrelevant links or refresh them.
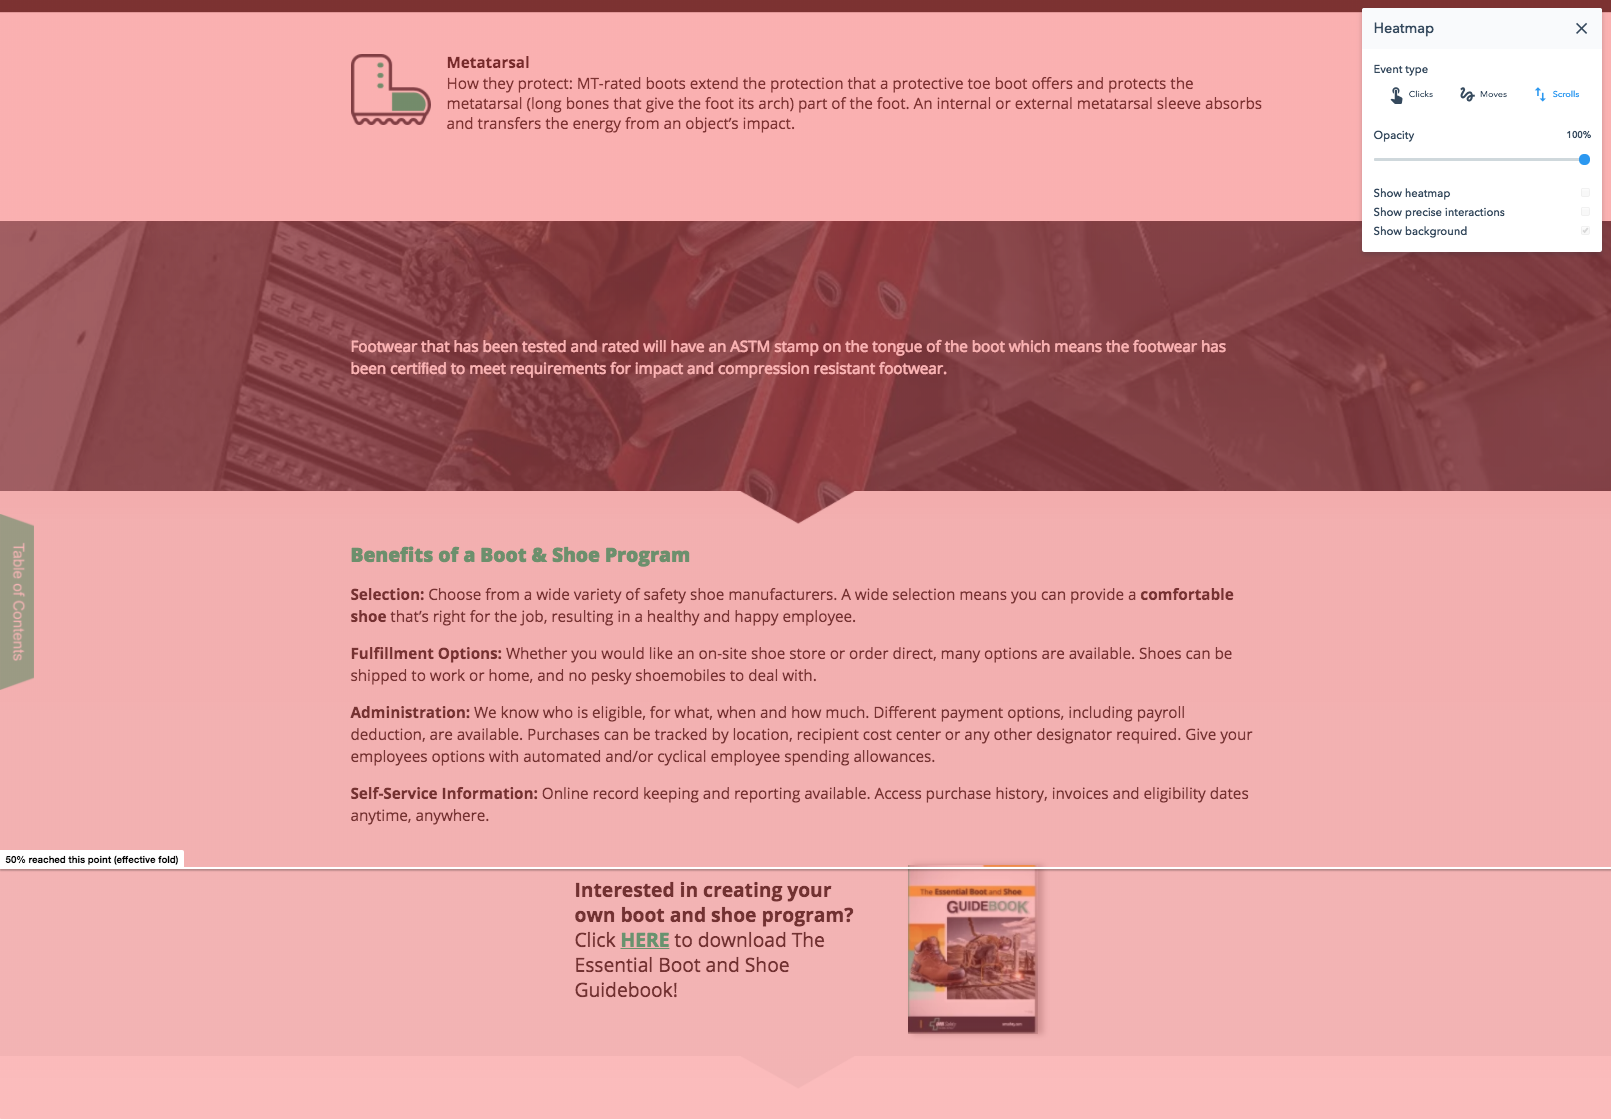
From here, you might even decide to make A/B tests of your pillar page to try new tactics like banner images, titles, etc.--and pair this data with your heatmap metrics. We did this with the pillar page above, and we were able to find some meaningful insights:
- When we added a banner CTA at the navigation and changed a header to a more program-specific term, we saw our bounce rates increased by 5%, our time on page dipped by 10 seconds, and our exit rate increased by 5%.
- These all show us that our original version was better: our organic and paid media viewers weren't wanting to see a CTA immediately upon landing, and they preferred the more generic header that matched their Google search instead of a Consideration Stage term specific to our company.
Use the Campaigns Tool to Track Influenced/New Contacts
If you're not yet using the HubSpot Campaigns tool to track your influenced and new revenue/traffic/contacts, which rock are you living under?
While I'm not a fan of making a new campaign for every single piece of marketing material (like a pillar page), when you divide your efforts into larger pieces of pie, you can gather important insight into which topics perform best and actually drive movement in your funnel and your bottom line.
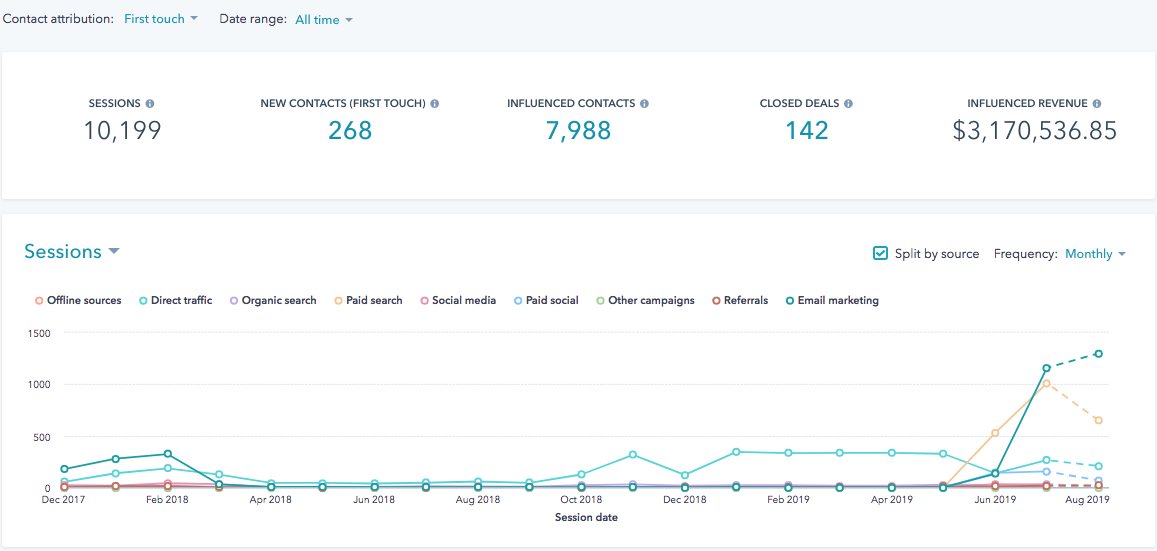
With this pillar page example, we tied it to our overall program campaign. Now, at a glance, we're able to see all of the marketing KPIs through the lens of the entire campaign we built around this pillar page. Between our 10 supporting cluster articles, 47 promotional social posts, 13 CTAs, 10 emails, and our supporting content like guidebooks and infographics, we've generated over 10k views to content around this program. We've also generated 268 new (first touch) contacts, influenced 8,000 total contacts, and influenced 142 closed deals in this program--for a total influenced revenue of a whopping $3.2 million.
How's That for ROI?
Sure, we can dive even deeper into attribution for each of these metrics, but by centralizing our performance tracking using this tool, we instantly shift our mindset to continual improvement, comparison to our other program marketing campaigns, and always associating our optimizations back to our KPIs.
You can filter out these metrics in the report's timeline to see exactly when you had spikes in performance on certain KPIs.
- Just added a new free download to your pillar page in June? Filter your time from May to present by week to see if you can attribute a spike in pillar page conversions to that optimization.
- Recently changed templates or tried optimizing for a different target keyword? View the report "All Time" for Views, and watch for the trends in traffic coming into the page and if it's grown since these changes.
Pro Tip After You're Done With a Round of Optimization
Don't forget to submit your pillar page to Google Search Console to be crawled again after your changes take effect. Show Google you've made an update, and request that they recognize those updates!
If you're looking for help in the pillar page arena (or implementing a longer-term marketing strategy with clear goals and objectives), talk to one of our team members about customizing a strategy to your business.
