

What is the first question sales folks ask themselves before beginning the sales process? How do they determine whether or not to interact with a lead? Is this lead qualified?
Lead scoring is the practice that answers this question. The concept of lead scoring has been around for a while now. These systems are used to grade and pre-qualify leads to the best of their ability before sales reps actually pick up the phone. When done successfully, grading systems help eliminate noise and unqualified leads from sales rep queues.
This is all well and good if you can afford one of these systems, but what about companies that either don’t have the funds for a lead scoring system or even those that haven’t implemented lead scoring correctly? Worry no more! We’ve got you covered. We’re going to walk through the process to set the foundation for lead scoring in HubSpot using a couple of reports. These reports will help y’all define your current customer’s behavior and then use those insights to either cherry pick leads for your sales team or act as your initial criteria for your lead scoring system.
What is Lead Scoring?
For any of you beginners who have no idea what I’m talking about at this point, I recommend checking out this post by Kelley Wrede to get more of an overview of what lead scoring is all about. For you more experienced folks, these reports will probably seem a little rudimentary for you. As I mentioned above, they are designed to establish a baseline for either building a lead scoring model or to act as a proxy for companies that can’t splash the cash on such a system.
Click here for a guide to set up lead scoring in HubSpot. To go one step further for you super advanced folks, check out this great blog post by Salesforce's lead scoring system Pardot on using lead scoring and lead grading in different situations (yes there is a difference between the two).
Before we discuss how to physically build these reports, we’re going to walk through the theory and logic behind them. Building the reports is actually very simple, but without the fundamental understanding of the metrics we’ll be pulling in, there are many pitfalls that could lead to misinterpretation of the data. I’ll explain the caveats as we progress through the explanation of each data point.
Segmenting Customer Behavior into Interaction Buckets
To be clear, using these reports to proxy lead scoring is not a perfect science. The insights you’ll derive from these KPI reports should be used as directional information and in conjunction with the signals your organization deems as significant gauges of lead quality.
That being said, there are essentially four high-level buckets that we’ll segment our lead quality gauging KPIs into:
- Social interaction
- Website interaction
- Email interaction
- Conversion activity
These four buckets are the main ways potential customers will likely take action to signal their readiness to buy, or at least start the conversation. Obviously, every organization is different and will leverage these segments in different fashions, so keep this in mind going forward. There is no one-size-fits-all solution when it comes to determining lead quality.
Let's examine each of the four buckets below.
Leveraging Social Media Interaction to Gauge Lead Readiness
In a general sense, the more an individual interacts with your company on a social network, the more engaged they likely are and the more likely they are to buy. For this reason, we’ll want to pull in specific metrics from each major social network. These are the four basic properties I recommend including:
- Social Interactions
- Facebook Clicks
- Twitter Clicks
- LinkedIn Clicks
The nature of your business will determine the value your business places on the clicks you receive from different social networks. Take into consideration that different social networks engage people in different fashions and cater to different audiences. These differences impact the quality signals you’re receiving. By that I mean a Facebook click might more valuable than a LinkedIn click, even if you receive more LinkedIn clicks.
Understanding Website Interaction to Determine Lead Pre-qualification
Let’s move on to website interactions.
You’ll want to include these metrics to measure prequalification from this angle:
- Website Interactions
- Number of Pageviews
- Number of Visits
- Last Page Seen
- Time of Last Session
Pretty straightforward KPIs, let’s break them down.
Number of Pageviews and Number of Visits. Your company’s website is your home base. Any traffic is good traffic and that traffic will result in quality leads, right? Not necessarily.
Web sites provide a plethora of information to digest, but not all of it is necessarily related to making a conversion or very telling about a lead’s purchase intent. A high number of page views and a high number of visits are both broad metrics that suggest serious engagement. It is typically safe to assume (depending on the nature of your site and business) that the higher these numbers are the more engaged and potentially qualified a lead might be. However, similar to social network clicks, you have to dig a little deeper to truly analyze the data. Remember: not all pages are created equal. To dig deeper, we’ll leverage the remaining two website interaction KPIs, as well as individual lead contact records.
Pro tip: you can’t pull in specifics from the contact record into the report we’ll build, but leveraging the detail on these records is a must.
Let’s say Nicolas Cage visits your actor coaching website 15 times (not that he isn’t already the greatest actor of our generation) and then let’s say he racks up 45 page views. He is clearly interested in something, but that’s all we really know at this point. Here is where the Last Page Seen and the contact records come into play.
Start with Last Page Seen on your future report. This metric records the last URL visited by a contact. In an ideal world, the last page Mr. Cage would have visited would be the thank you page from a contact us form or a pricing page, two of the highest signals of quality buyer intent. If that happens to be the case then you’ve got a very telling indicator of quality already. It's important to understand, people don’t just fill out a form and stop there. People will continue to hop around your site, meaning this field will be overwritten. That being the case, you’ll more than likely find something different than a conversion path thank you page URL in this field. Observing the Last Page Seen, in combination with a relatively high count of Number of Pageviews, is your signal to open up Nic’s contact record and see the actual pages he’s visited.
Filter the contact’s activity timeline down to only Page Views to take that closer look.
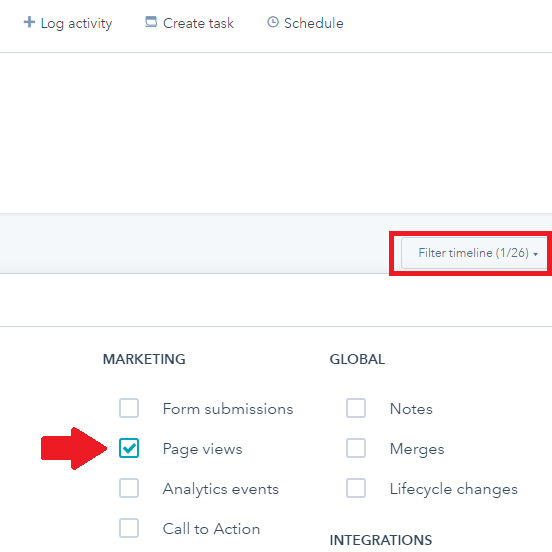
There are two buckets website pages fall into, buyer intent pages and education intent pages. Here are some examples of both:
Buyer Intent Pages
- Pricing pages
- Vendor comparison pages
- Bottom of the funnel conversion pages
- Schedule a demo
- Download a free trial
- Contact sales
These pages all focus on later stage buyer interaction. People visiting these pages are more likely further along in the process and are probably more ready to speak to a sales rep.
Education Intent Pages
- High-level product or summary pages
- Top and middle funnel focused blogs pages
- About us pages
- The home page
These pages are very surface level in nature. Prospects checking out these types of pages aren’t likely in a purchase mindset. Should you see individuals spend the majority of their time on these educational style pages, consider a pretty indicative sign that they aren’t completely qualified enough to speak to sales just yet.
An important caveat to all of this is progressive site interaction, how people interact with a site and move deeper into its content over time. The majority of most website content targets a higher funnel mindset and is educational in nature. You use this broad informational content to capture attention and then entice people to interact more and more with buyer intent focused pages.
Now that you understand this funneling effect, if you see a high count for Number of Page Views and then see that the majority of their time is spent on educational pages, don’t disqualify them right away. Pay attention to that contact’s progressive use of your website. Just as with using Last Page Seen, if their most recent views are on buyer intent focused pages, they are probably more qualified prospects.
This brings us to the last of the website interaction KPIs, Time of Last Session. Timing is everything, and especially on the internet. How recently something took place matters a great deal.
Let’s jump back to the great Nicolas Cage. Let’s say he has been all over your site. His count for Number of Pageviews and Number of Visits are high. He started off with educational content, progressed into buyer-focused content, and then took the necessary conversion action to signal his qualified readiness. Unfortunately, your sales rep didn’t reach out in a timely fashion and it’s now been over a week since Mr. Cage has visited your site. It’s a real face off.
Having gone through everything that he was supposed to do in order to qualify himself as a lead, Nic should have been followed up with promptly, but wasn’t. Now a significant amount of time has passed since the Cage last interacted with your site. Even though all of the initial signals of qualification and readiness were met, that gap in time will mean he probably isn’t as qualified as he once was. Your content and products aren’t as fresh in his mind anymore.
This isn’t to say he is a total lost cause and can’t be salvaged, but you should expect that his perceived quality and readiness to buy have taken a hit. Timing is everything.
Email Engagement as a Readiness Signal
On to the next segment, email interactions.
Thankfully, email interactions operate very similarly to website interactions. Since they can be interpreted in close fashion, we won’t have to spend a lot of time on this segment.
Here are the email KPIs we’ll be including:
- Email Interactions
- Emails Clicked
- Last Email Click Date
Starting off with Emails Clicked, this field should be gauged the same as social clicks and Number of Pageviews. Usually higher counts indicate more engagement with your brand and probably a higher propensity to be qualified as a lead.
Pro tip: Be careful and make sure you a using Emails Clicked and not Emails Opened. Those are two very different metrics.
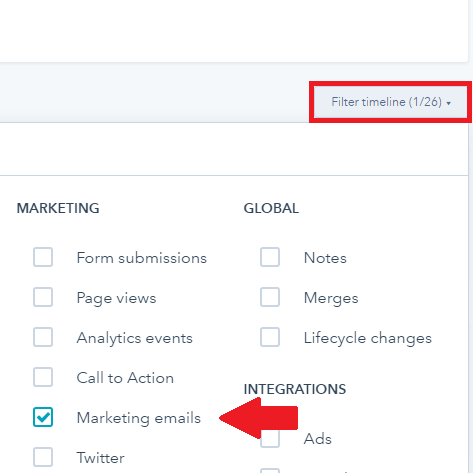
Just as with Number of Pageviews you’ll have to dig deeper than just the count of Emails Clicked. A high count only tells you so much. pen up specific contact records and filter down to marketing emails they engaged with to get a sense of what types of emails these contacts on interacting with the most. Again, be sure to gauge them on clicks and not just opens.
If interaction is steady with high buyer intent emails you’ve got another strong indicator in your pocket that you’re dealing with a potentially ready prospect. The opposite is true if you find a lot of clicks on educational intended emails.
Lastly, cross compare the Emails Clicked field with the Last Email Click Date. Timing is everything and if a substantial amount of time has passed since a contact last clicked an email, regardless of their initial potential readiness, assume their readiness has taken a hit. If your company isn’t top of mind with prospects, y’all will have ground to make up. It’s a good idea to compare Last Email Click Date with Time of Last Session. Looking at the two together will give you a more complete picture while avoiding a myopic point of view.
Conversion Activity, the Equivalent to Raising a Hand
Conversion activities round out our fourth and final interaction bucket. We’ll be including the following fields in the report:
- Conversion Interactions
- Number of Unique Form Submissions
- Number of Form Submissions
We’ll also be leveraging individual contact records again, just as with the previous two interaction groups.
Form submission counts are very straightforward. More submissions mean more engagement and probably higher prequalification. However, if your site has several different types of forms for the top, middle, and bottom of the funnel, you’ll want to investigate individual contact records to learn more.
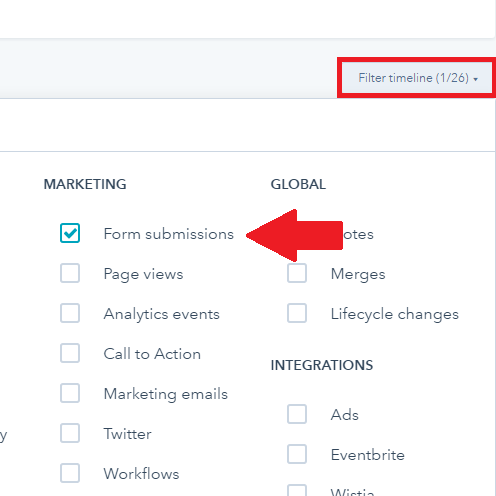
Filter down to the specific forms that have been submitted. Just as not all pages are created equal, not all forms are created equal. If you find that that the contact has only submitted top and middle funnel focused forms they might not be ready to have that sales conversation. However, if they have submitted bottom of the funnel forms, you’ve got one of the most telling pre-qualification signals possible.
Building the Customer Behavior Lists and Analyzing the Results
Now that we’ve wrapped up discussing all of the theory and logic behind the fields we’ll be using, let’s build these lists.
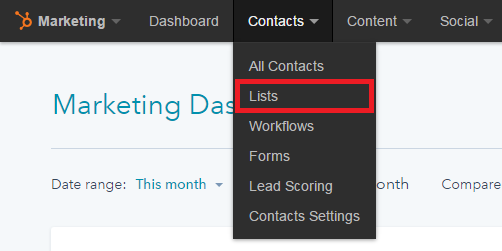
Start off in the Marketing interface, open the Contacts tab, and then select Lists.
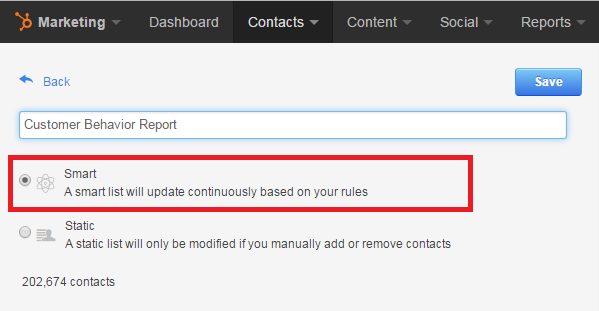
From here you’re going to select a New List in the top right corner of the screen. After the list panel opens, name the list whatever suits your fancy and then select Smart as the list type.
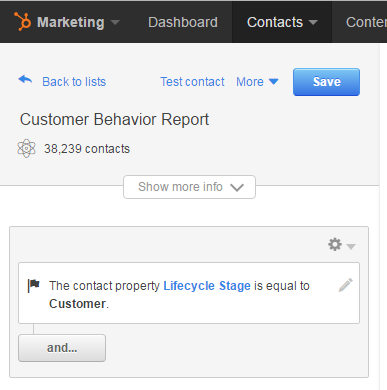
The only filter we’re going to add to the first list is a Contact Property filter for Lifecycle Stage “equal to Customer.”
After that step, all you have to do is edit the list’s columns to include all of the interaction segment KPIs we’ve already discussed. Here is the complete list, in my suggested order, along with all of the necessary contact record identifier fields:
- First Name
- Last Name
- Lifecycle Stage
- Facebook clicks
- Twitter clicks
- LinkedIn clicks
- Number of Pageviews
- Number of Visits
- Last Page Seen
- Time of Last Session
- Emails Clicked
- Last Email Click Date
- Number of Unique Form Submissions
- Number of Form Submissions
Pro tip: Include Original Source Type in the column fields to gauge lead interaction and prequalification not only on a person-to-person basis but also on a channel-by-channel basis as well. Certain inbound marketing channels tend to produce better-qualified leads than others, depending on the nature of your business.
Save the list and you’re done with the first list.
Because this first list is customer focused, you’ll use it to set your baselines for your future prospects. Export this list to Excel to perform your analysis. The trends, patterns, and commonalities you’ll identify in this customer list will serve one of two purposes depending on if you’re setting up lead scoring or need a proxy because you don’t have it.
If you are setting up or overhauling a lead scoring system, the insights you pull from this list and the contact records will be to used to set your initial lead scoring parameters. Prospects that show more engagement and interact with more buyer-centric content should receive higher scores. Prospects that show less engagement should receive lower scores and be withheld from sales reps until their scores rise. If this your use case for this list, you don’t really need to build the second list.
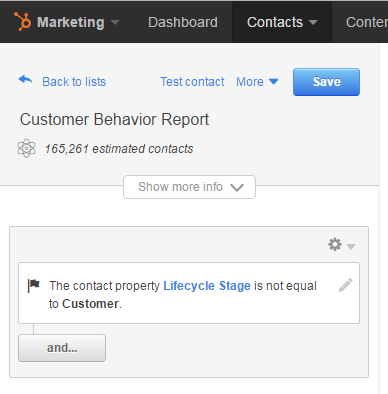
If you’re using this list as a proxy for lead scoring, the insights you’ll pull from this list and the contact records will still serve as your means to establish a baseline, but you’ll need to build the second list to reap any benefits. To build the second list, repeat the exact same steps above. However, instead of setting the Contact Property filter to “equal to Customer,” change it to “is not equal to Customer.” Then save the list.
It might also be helpful to add some relevant date parameters to make the contact list more manageable.
With your baselines from the first list serving as your lead scoring system, dissect this second list to cherry pick leads that possess similar profiles to your current customers from the first list. Perhaps design a flagging system using a custom property to notify your sales rep counterparts of who meets the necessary criteria to warrant a phone call.
Remember to always consider each of the four interactions buckets when assessing lead prequalification:
- Social interaction
- Site interaction
- Email interaction
- Conversion form submission
Using just one or two to base your decisions will almost always end in sub-optimal results.
As a final note, and to restate a disclaimer from the beginning of the post, these lists are not a perfect science and these insights should be used as directional. Particularly if you are using these lists as a proxy, I strongly suggest being more lenient than strict when deciding on who gets to talk to sales reps and who doesn’t. As you put this into practice, record the results your sales team has with the leads you picked for them. If success isn’t showing, refine your baselines to better define this profile.
For more sales performance reporting check out my recent post about lead engagement vs sales outreach. This post expands upon the points I made about reaching out to leads in a timely fashion to touch them when they're in the buying mindset.